Crash And Burn, Then Dump And Debug
Managed Code Makes Us Forget The Bad Ol’ Days Of Crashes
In the late eighties, during and after college, I earned my basic debugger stripes by analyzing mainframe cobol stack dumps and DOS/C++ debugging (on a French videotext server product). Thank God for me, my passion was Smalltalk and then later other now traditional virtual machine-based languages like Java and C#. I do remember working with one of the awesome architects of the Digitalk Smalltalk virtual machine on analyzing VM crashes, where we would try to make our way back to a Smalltalk stack frame and find the offending method. But then, I must have been lucky, as I have not personally had to investigate a real crash OS crash myself until recently.
At work, we recently purchased a package, implemented in a mix of C++, COM, and .NET. All components of the solution but one are working great. That component is a rich client built on .NET 3.5 which integrates some third party controls. So far on all our XP workstations we consistently get a crash. To help the vendor narrow down the issue I decided to investigate what the crash was all about. What I needed was to get a crash dump so I could upload it to the vendor for analysis using WinDbg, the Windows Debugger. This post summarizes my experience.
To follow along, you can reference Trey Nash’s post and use his test source like I did. So I created a new folder called CrashAndBurn under C:Program Files. Then I created a C# source file named test.cs and pasted Trey’s example. I then compiled it using the command:
csc /debug+ test.cs
Now when you run it you should get an exception. Good! We now have a test subject!

Crash And Dump
To make this happen I first needed to get setup with all the necessary tools:
- Install the Windows symbols package
- Install the Windows Debugging tools
- Add the location of the Windows Debugging tools to your Windows system PATH environment variable
When you install the debugging tools, you get WinDbg the main Windows Debugger and ADPlus a script that will allow you to capture a crash and create a dump.
Now we can get started:
- Open a command window
- Get ADPlus to start your application and create a dump by typing the following command:
ADPlus -crash -FullOnFirst -sc “C:Program FilesCrashAndBurntest.exe” -o “C:Program FilesCrashAndBurn” - ADPlus will kick off your app as well as a command window, then will write out the crash dump to a new directory under the one specified in the “-o” parameter
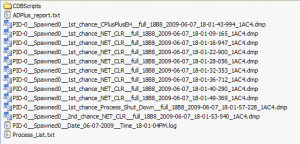
- Now navigate to the dump folder and check out its contents
- Now you can kick off WinDbg, then open the latest dump file

Crash dumps

Now you’re ready to analyze the crash!
Analyzing The Crash
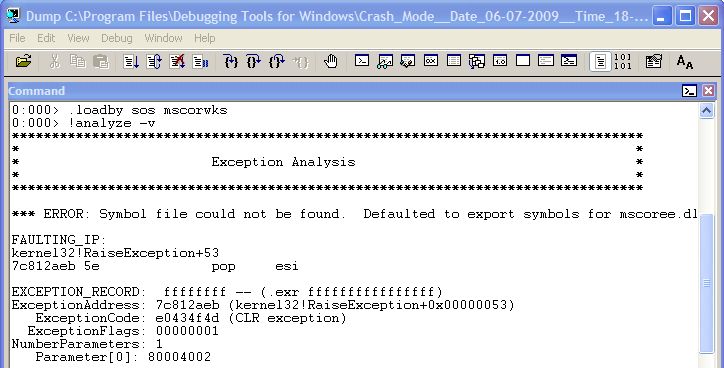
Let’s run the following commands in WinDbg:
.loadby sos mscorwks

!analyze -v
This will give us a starting point in terms of figuring out where the exception was.

Of course you may have to do more “digging” for the root cause. Here is the output:
Notice the following text inside the verbose output:
Exception object: 013f4a94 Exception type: System.InvalidCastException Message: Unable to cast object of type 'C' to type 'A'. InnerException:StackTrace (generated): SP IP Function 0012F418 00DC01F5 test!EntryPoint.DoSomething()+0x155 0012F480 00DC0088 test!EntryPoint.Main()+0x18
This tells us that a cast exception occurred, which the exception that Trey wanted to intentionally trigger.
To learn more I recommend to look up Tess Ferrandez blog since she has a ton of details and some labs.
References And Resources
These blogs and resources are all “must-read” and “must-bookmark”!


